
Post-Event Revenue Analytics: How to Turn Attendee Data Into Pipeline and Expansion Revenue


The event is over. The booth is packed up. The last flight home lands Sunday night. By Monday morning, the sales team has a spreadsheet with 400 names and the same question they ask after every event: who do we call first? The answer most organizations give is: the ones who stopped by the booth. Or the ones who downloaded the session slides. Or whoever scanned the highest badge count. These answers feel like action. They are not analytics.
Post-event revenue analytics is the discipline of turning raw attendee data into prioritized, contextually rich sales intelligence.
It means knowing not just who attended but what they attended, what it signals about where they are in a buying journey, whether they are a net-new prospect or an existing customer signaling expansion intent, and what specific conversation the sales or customer success team should be leading with on Monday morning. This post covers the complete framework:
how to read attendee behavior as a buying signal
how to segment post-event data into tiers that map to specific sales motions
how to arm sales with contextual intelligence rather than generic lead lists
how to build the workflow in your MAP and CRM that makes this repeatable across every event you run
Event-sourced leads deliver a 40% opportunity-to-close conversion rate compared to 5 to 10% for average B2B inbound. The variable that separates organizations that capture that conversion rate from those that don't is not the quality of the event. It is the quality of the follow-up workflow.
The Post-Event Revenue Gap: Why Most Follow-Up Fails
Every event produces 2 outputs:
The first is the event itself: sessions attended, conversations had, relationships built, brand impressions made.
The second is the data trail the event leaves behind: attendance records, session logs, booth scan timestamps, survey responses, app interactions.
The first output gets enormous organizational attention. The second is almost universally wasted.

The typical post-event workflow looks like this:
The events team exports the badge scan list from the event platform.
Marketing / Revenue operations imports it into Salesforce as a campaign list.
An email nurture sequence fires to every contact on the list simultaneously.
The SDR team works through the list in alphabetical or chronological order.
Within 2 weeks, the list is exhausted, a handful of meetings are booked, and the attribution discussion begins. What was lost: the signal in the data:
The contact who attended three sessions on procurement optimization and visited two contract management vendor booths was telling you something specific.
The customer who sat in on the advanced implementation session and submitted a survey asking about integration partners was telling you something different.
The prospect who registered, checked in, and left after 45 minutes was telling you something different still. All three received the same generic follow-up sequence.
The post-event revenue gap is not a follow-up volume problem. Most sales teams follow up plenty. It is a prioritization and contextualization problem. The data to solve it existed in the event platform export. It just was not used.
Attendee Behavior as a Buying Signal: What Session and Booth Data Actually Tells You
Session attendance and booth visit records are not logistics data. They are intent signals. The question is whether your team knows how to read them.

Consider what it means when a net-new prospect from a target account attends your session on total cost of ownership and ROI modeling. They are signaling they are evaluating a purchase decision. They are past the awareness stage and into the business case stage. The sales conversation should open with the business case, not the product demo.
Consider what it means when an existing customer attends your advanced deployment session and then stops by your professional services booth for 12 minutes. They have hit a wall in their implementation. The customer success team should know about this within 24 hours, not two weeks.
Consider what it means when a prospect attended two competitor sessions and one of yours at a neutral trade show. They are actively comparing vendors. Timing on outreach is everything and the content of that outreach should acknowledge the comparative evaluation context, not pretend it does not exist.

The intent trifecta session attendance plus booth visit plus survey response produces the highest-quality signal in the post-event data set. Each element adds a layer:
Session attendance tells you what topic they were willing to spend 45 minutes on. At a three-day conference with 60 session options, session choice is a deliberate act. It reflects current priority.
Booth visit tells you they were willing to self-identify as interested in a vendor conversation. At a conference, walking into a sponsored booth is an active choice, not a passive one. Dwell time adds precision: 3 minutes is curiosity, 12 minutes is a serious conversation.
Survey response tells you what problems they are willing to put in writing. Survey responses about specific capability gaps, integration questions, or evaluation timelines are among the most direct buying signals any marketing program generates.
Cross-hatching this behavioral trifecta against MAP engagement history what campaigns they have responded to, what content they have downloaded, how long they have been in the database produces a richly contextual lead profile that no generic follow-up sequence can address.
The Segmentation Framework: How to Cut Attendee Data for Sales Action
Not every attendee deserves the same follow-up. In fact, treating every attendee the same wastes sales capacity on low-signal contacts while under-serving the high-signal ones who needed an immediate, specific response.

The segmentation framework we use across marqeu implementations cuts the post-event attendee list into 4 tiers based on two dimensions:
account relationship (new prospect vs. existing pipeline vs. existing customer)
behavioral engagement depth (high engagement vs. general attendance)
Tier 1 Net-new, high engagement. Net-new accounts from the target account list that attended multiple sessions, visited the booth, or submitted a survey. These contacts have self-selected as high-intent and are not in any existing pipeline. The sales motion is immediate SDR outreach within 48 hours with session-specific context. The opening message references what they attended and why it connects to the conversation the sales team wants to have. No generic nurture sequence.
Tier 2 Existing pipeline, relevant session attendance. Contacts already in an open opportunity who attended sessions relevant to their current deal stage. This is the deal acceleration motion. The sales rep receives an alert within 24 hours with the specific context: "Your prospect at [account] attended the ROI and business case session. Lead with the business case conversation in your next touch, not the product demo." This changes what happens in the sales conversation before it happens.
Tier 3 Existing customer, product or expansion signals. Current customers who attended sessions on product areas they do not currently use, or who visited partner or professional services booths, or who submitted surveys mentioning capability gaps. This is the customer success expansion motion. The CS team receives specific context: "Your customer at [account] attended the advanced analytics session and spent 8 minutes at the implementation services booth. Flag for expansion conversation within the next two weeks."
Tier 4 General attendance, no strong signal. Registered attendees who attended general sessions and exhibited no strong behavioral signal. These contacts go into a standard post-event nurture sequence. No sales capacity spent here until a signal emerges.

The tier assignment logic runs on three fields from the event platform export: session attendance count, booth visit flag, and survey completion. Cross-hatched in the MAP against contact record type (prospect vs. customer), account stage in Salesforce, and ICP score. The output is a segmented attendee list where every name has a tier assignment and a recommended next action before the sales team opens their inbox Monday morning.
Arming Sales With Contextual Intelligence, Not Just Lead Lists
A lead list is a list of names. Contextual intelligence is a set of facts about each name that changes how the sales conversation starts.
The difference in outcome between these 2 deliverables is not marginal. A sales rep who opens a call knowing the prospect attended a session on data warehouse migration, downloaded your integration guide three weeks before the event, and spent six minutes at your technical implementation booth is having a fundamentally different conversation than a rep who opens a call with "I saw you attended our event I wanted to follow up."

The contextual intelligence deliverable for each Tier 1 and Tier 2 contact contains 4 elements:
Behavioral summary: What specific sessions did they attend, what booth visits occurred, did they submit a survey and what did it say. This is the raw behavioral record, translated into plain language.
MAP engagement history: What campaigns has this contact engaged with prior to the event. What content did they download. How long have they been in the database. This context answers the question of where they are in their buying journey relative to their first contact with your brand.
Account context: Are there other contacts from this account in the database or in an open opportunity. What stage is any open opportunity at. What is the account's ICP score and territory assignment.
Recommended talk track: Based on the behavioral and account context, a specific opening sentence or angle for the first outreach. Not scripted framed. "Lead with the ROI business case because they attended that session" is a talk track frame that takes 10 seconds to read and changes the entire direction of the conversation.
This deliverable is built in the MAP (Marketo or HubSpot) as a campaign member view with custom fields for session data, engagement score, and next action. It is surfaced in Salesforce as a campaign member detail view that the sales rep sees when they open the account or contact record. It takes 20 minutes to build the first time. It runs automatically for every subsequent event.
The Cross-Sell and Upsell Play: Using Event Data for Customer Expansion
The customer expansion opportunity in post-event data is the most underutilized revenue play in B2B events programs. Most organizations treat events as a pipeline generation motion. The customers who attend are a logistics afterthought they are on the list, they got the same nurture sequence as the prospects, and nobody thought specifically about what their attendance signals.

The expansion signals in event attendee data are often more explicit than anything the customer success team is getting from product usage data alone.
A customer who attends an advanced analytics session at your user conference is likely signaling they are pushing up against the ceiling of their current implementation. They may not have articulated this in a business review. But the session choice tells you they are thinking about it. The CS team conversation should happen within two weeks: "We saw you were interested in our advanced analytics session we would love to walk you through what customers at your stage are typically doing next."
A customer who visits a competitor booth at a neutral trade show is sending two signals simultaneously: they are evaluating alternatives, and there is an unmet need your product is not currently addressing. Both signals are actionable. The account manager should be the first person to know, and the conversation should be a discovery call about what they are looking for rather than a defensive pitch.
A customer who submits a survey response mentioning a specific integration gap, a workflow problem, or a question about a product area they do not use is handing the CS team a conversation starter that would otherwise take two quarters to surface through a standard business review cycle.

Building this workflow requires 3 additions to the standard post-event data flow:
First, the event platform export must include a customer flag a field that distinguishes current customers from prospects in the attendee list. This is typically a domain match against the Salesforce account type field.
Second, a custom property on the Salesforce account record captures the event engagement tier and the specific signals for that customer.
Third, a workflow in the MAP triggers a task for the account-owning CS rep when a customer is tagged as Tier 3, with the contextual summary attached.
The expansion pipeline this generates is categorically different from expansion pipeline sourced through outbound CS outreach or renewal conversations. It is anchored in explicit behavioral signals, which means the conversion rate from expansion conversation to expansion opportunity is materially higher
Measuring Post-Event Pipeline Velocity: Leading and Lagging Indicators
The measurement framework for post-event revenue analytics has 2 layers:
Leading indicators that tell you whether the follow-up workflow is working in the days and weeks after the event
Lagging indicators that tell you whether the event produced revenue in the months after it.

Leading indicators are measurable within 30 days of the event:
Meeting booked rate by engagement tier. What percentage of Tier 1 and Tier 2 contacts accepted a meeting within two weeks of first outreach. This is the primary quality signal for the contextual intelligence deliverable if the talk tracks are right, this rate is significantly higher than generic follow-up.
Tier 1 outreach response rate. Of the net-new, high-engagement contacts who received session-specific outreach within 48 hours, what percentage responded positively. This tells you whether the behavioral context you are surfacing is resonating.
Expansion conversation rate for Tier 3. Of the customers flagged as expansion signals, what percentage of CS reps had a substantive expansion conversation within three weeks. This tells you whether the workflow is reaching the CS team and whether they are acting on it.
Lagging indicators** are measured at 90 and 180 days:

Event-influenced pipeline by segment. Opportunities created within 90 and 180 days, segmented by the attendee tier the contact was placed in post-event. This is the primary revenue story Tier 1 contacts should produce the highest pipeline velocity, Tier 2 the highest deal acceleration.
Attendee-to-SQL conversion rate by session track. Of contacts who attended the ROI and business case session, what percentage became sales-qualified leads within 90 days. Of contacts who attended the technical implementation session, what percentage. This tells you which sessions are high-intent and should be prioritized in the content track for the next event.
Customer expansion pipeline from event-engaged customers. Expansion opportunities created from Tier 3 contacts compared to expansion opportunities from non-attending customers in the same period. This is the measure of event value to the customer success motion.
Post-event sales velocity. Time from event attendance to opportunity creation to close, compared to non-event-sourced deals. Event-influenced deals consistently close faster because the relationship and context are already established measuring this demonstrates the velocity premium that events produce when follow-up is done correctly.
Building the Post-Event Analytics Workflow in Your MAP and CRM
The workflow that turns event attendee data into contextual sales intelligence operates across four systems. Each step is distinct, sequential, and automatable after the first implementation.

Step 1 Event platform export: Cvent, Bizzabo, or Splash produces the raw export: attendee list with email and company domain, session attendance records with timestamps, booth scan records with dwell time where available, and survey responses linked to attendee identifier.
Step 2 MAP ingestion and scoring: The export is imported into Marketo or HubSpot as a campaign. Each attendee becomes a campaign member. The engagement score field is calculated: sessions attended multiplied by a weight, plus booth visit flag multiplied by a weight, plus survey completion flag. The output is a numeric engagement score for every attendee that drives tier assignment.
Step 3 Salesforce tagging and alert triggers: Campaign member data syncs to Salesforce contacts and accounts. A custom field on the contact record captures engagement tier, session list, and next action. A workflow rule triggers a Salesforce task for the account-owning sales rep (Tier 1 and Tier 2) or CS rep (Tier 3) within 24 hours of the campaign member sync, with the contextual summary populated from the custom field data.
Step 4 Data warehouse cross-hatch: In BigQuery, Snowflake, or Databricks, the event campaign member data is joined against the full MAP engagement history and Salesforce pipeline data. This produces the full contextual intelligence record: behavioral signals from the event, MAP engagement history, account stage, open opportunity status, ICP score. The output feeds the sales intelligence view and the 90-day pipeline attribution model simultaneously.

The first implementation of this workflow for a new client typically takes 2 to 3 weeks one week to configure the MAP campaign structure and engagement score logic, one week to build the Salesforce tagging workflow and alert triggers, and a final week to validate the data warehouse join and confirm the intelligence view is surfacing correctly. From the second event onward, the workflow is fully automated. The events team exports the data, the system does the rest.
Frequently Asked Questions About Post-Event Revenue Analytics
What is post-event revenue analytics?
Post-event revenue analytics is the process of turning raw event attendee data session attendance, booth visits, survey responses into prioritized sales and customer success intelligence. It involves segmenting attendees by engagement depth and account relationship, building contextual talk tracks for each segment, and measuring pipeline and expansion revenue generated through post-event follow-up.
How do I use attendee data to prioritize sales follow-up?
Segment attendees into four tiers based on engagement depth and account type: Tier 1 (net-new, high engagement immediate SDR outreach), Tier 2 (existing pipeline, relevant sessions deal acceleration alert to sales rep), Tier 3 (existing customer, expansion signals CS team alert), Tier 4 (general attendance standard nurture). Cross-hatch session attendance, booth visit, and survey data against Salesforce account stage and MAP engagement history to assign each contact a tier before the sales team returns from the event.
How do events drive customer expansion revenue?
Customers who attend sessions on product areas they do not currently use, visit partner or implementation booths, or submit surveys mentioning capability gaps are generating expansion signals that a standard business review cycle would take two quarters to surface. Capturing these signals in the event platform export and routing them to the account-owning CS rep as a structured alert with behavioral context attached produces expansion conversations anchored in explicit intent rather than scheduled check-ins.
What metrics should I track for post-event follow-up?
Leading indicators within 30 days: meeting booked rate by engagement tier, Tier 1 outreach response rate, Tier 3 expansion conversation rate. Lagging indicators at 90 and 180 days: event-influenced pipeline by segment, attendee-to-SQL conversion rate by session track, customer expansion pipeline from event-engaged customers, and post-event deal velocity compared to non-event-sourced opportunities.
Ready to Build Your Post-Event Revenue Workflow?
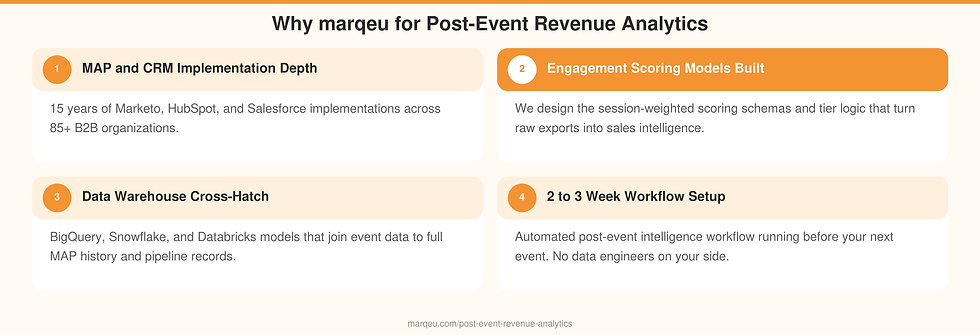
Every event your organization runs produces a data trail that could be driving pipeline and expansion revenue for the next three to six months. The workflow to activate that data is not complicated. It is a configuration project MAP campaign structure, Salesforce custom fields, engagement score logic, alert triggers, data warehouse join. Most of it can be built in two to three weeks. What most organizations lack is not the platforms to do this they already have Marketo or HubSpot, Salesforce, and a data warehouse. What they lack is the schema design, the engagement scoring model, and the workflow architecture that connects the event export to a sales intelligence view that sales reps actually use.
This is the work marqeu does across B2B software, hardware, networking, data, and security companies. We combine 15 years of MAP and CRM implementation depth with the SQL and Python skills to build the data warehouse layer that makes cross-event segmentation and 180-day attribution possible without adding data engineering headcount.
To discuss what building this capability looks like in your specific environment, start a conversation with our marketing analytics consulting practice.
For the strategic framework that governs the full events analytics lifecycle from pre-event targeting through post-event pipeline measurement see our event marketing analytics framework. For the attribution model that connects your event spend to closed revenue at the program level, see our event pipeline attribution guide.
For organizations building analytics infrastructure across demand generation, ABM, attribution, and database strategy, marqeu's B2B marketing analytics consulting practice covers the full scope from first data audit through board-ready reporting.
Book a Marketing Analytics Readiness Audit. With our marketing analytics consulting services, let us evaluate your current stack and give you a roadmap to building unified marketing analytics capabilities at your organization.


Comments