
Event Pipeline Attribution: How to Connect Your Event Spend to Closed Revenue
- marqeu

- 15 hours ago
- 12 min read

Every B2B CMO has been in this room. The quarterly business review. The CFO opens the events budget line. It is the largest single number in the marketing column. The question is not hostile it is simply the question that every investor asks: what did we get for this?
If the answer is "the booth was busy" or "we had strong attendance," the conversation is over before it starts. Budget cuts follow. Not because events don't work.
The incremental pipeline lift from properly attributed events at 33x but because the measurement infrastructure wasn't built to capture what events actually produce.
Event pipeline attribution is the methodology that closes this gap.
It is the process of connecting attendee data, platform engagement records, MAP history, and CRM pipeline data into a single model that answers the CFO's question with pipeline numbers, not attendance numbers.
This post covers the complete implementation:
how to distinguish event-sourced from event-influenced pipeline
why standard attribution windows miss most of the impact
how to build the Salesforce campaign hierarchy that makes roll-up reporting possible
how to construct the data warehouse model that native platforms cannot produce
The QBR Problem: Why "The Booth Was Busy" Is Not a Pipeline Answer
The fundamental problem with event measurement is a mismatch between what events produce and what the tools designed to measure them were built to capture.

Event platforms Cvent, Bizzabo, Splash are operations tools. They track registrations, check-ins, and session logistics. They are exceptionally good at telling you who showed up. They are not built to tell you what happened to those people afterward, how many became opportunities, or how long it took a deal to close from the moment a prospect first walked into your booth.
Marketing automation platforms Marketo and HubSpot are campaign tools. Their attribution models treat events as campaigns and calculate influence based on touchpoint proximity to opportunity creation. The default attribution window is 14 to 30 days. For a B2B deal cycle running 6 to 9 months, that window captures a small fraction of the actual event impact.
Salesforce is the source of truth for pipeline. But Salesforce only knows what it is told. If the campaign member data flowing in from the MAP is incomplete missing engagement depth, missing session attendance, missing activity-level attribution the pipeline reports that come out are equally incomplete.
The result is a measurement gap that compounds with every passing quarter. Events are expensive. The measurement infrastructure to justify them costs almost nothing relative to the event budget itself. The gap is not a resource problem. It is an architecture problem.
According to Demand Gen Report's 2025 survey, only 21 percent of B2B marketers can measure event ROI with confidence. The remaining 79% are making budget decisions about their largest channel based on attendance data and intuition.
Event-Sourced vs. Event-Influenced Pipeline: Why the Distinction Matters to Your CFO
The single most important conceptual shift in event pipeline attribution is the distinction between sourced and influenced pipeline. These are not interchangeable terms. They answer different questions, and they require different data.
Event-sourced pipeline measures net-new opportunities where the event was the first meaningful touch. Specifically: a prospect attended your event, had no prior engagement with your company in the MAP or CRM, and became a qualified opportunity within the attribution window. The event opened the door that would not otherwise have been opened. This is the most direct measure of event-generated revenue.
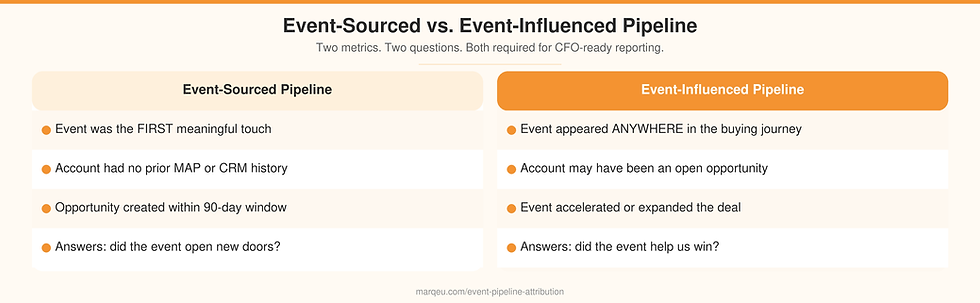
Event-influenced pipeline measures opportunities where the event appeared as any touchpoint in the account's buying journey regardless of whether it was the first touch, the last touch, or somewhere in the middle. An account already in an open opportunity attended your user conference session on advanced deployment. Three weeks later, they accelerated through the evaluation stage. The event did not source that opportunity, but it influenced it. That influence has dollar value, and it belongs in the pipeline story.
Most organizations report only one of these two numbers usually sourced pipeline, which dramatically understates impact. A VP of Sales who attended your keynote and moved a stalled deal forward is not captured by sourced-only attribution. Neither is the existing customer who heard your product roadmap and expanded their contract.
The CFO-ready pipeline story requires both numbers. Sourced answers "did the event open new doors?" Influenced answers "did the event help us win?" Combined, they produce a complete picture of revenue contribution.
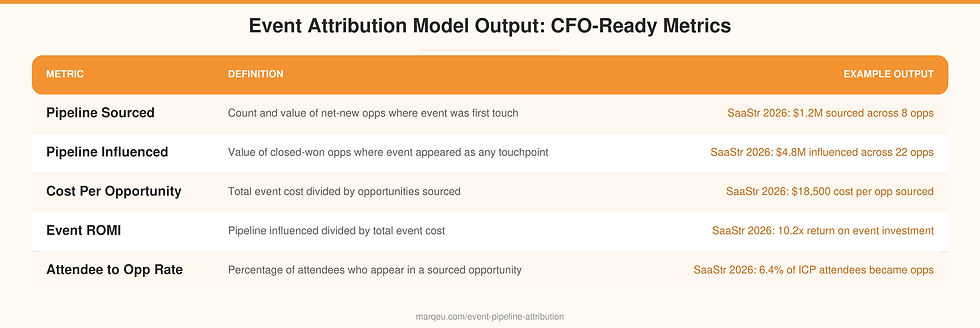
For the marqeu attribution framework we implement across B2B clients, the standard reporting surface shows both metrics side by side:
sourced pipeline count and value
influenced pipeline count and value
cost per opportunity (total event cost divided by opportunities sourced)
event ROMI (pipeline influenced divided by total event cost)
The Attribution Window Problem (and Why 14 Days Is Always Wrong)
The default attribution window in Marketo and HubSpot is 14 days. Some organizations extend this to 30 days after reading best-practice guides. Both numbers are wrong for B2B events attribution.
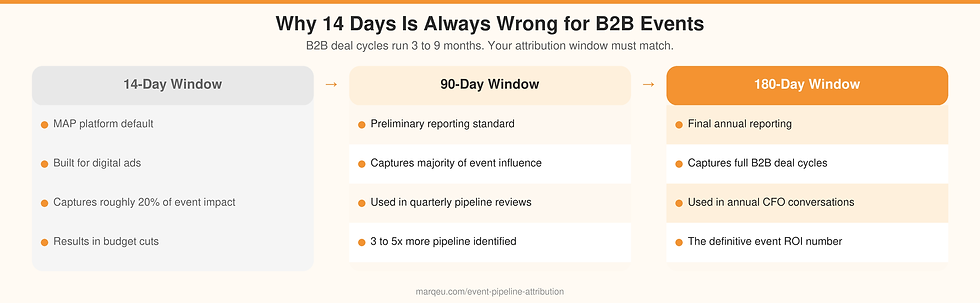
Here is why. A mid-market B2B software deal typically runs 60 to 180 days from first meaningful engagement to signed contract. An enterprise deal often runs 6 to 12 months. A prospect who attended your event in January and became a closed-won account in August was, in fact, influenced by your event. A 14-day attribution window reports that influence as zero.
The correct attribution window architecture for B2B events has 2 stages:
A preliminary window of 90 days captures the majority of attribution impact while the event is still reasonably fresh in the buyer journey. This is the number used in quarterly reporting the preliminary pipeline picture.
A final window of 180 days is applied at the annual close to capture all deals where an event touch appeared in the journey. This is the number used in annual planning conversations with the CFO.

Organizations that move from 14-day to 90-day attribution windows consistently see event-influenced pipeline numbers increase by 3 to 5 times. This is not because more pipeline suddenly appeared it is because the measurement was finally capturing pipeline that was already there. The practical implementation:
In Marketo, this requires a custom field on the Opportunity object or a campaign member last-activity date that flows into a data warehouse for custom attribution modeling.
In HubSpot, it requires the same custom property setup. Native platform attribution within 30 days will always undercount impact in B2B contexts.
The 90-day and 180-day windows live in the data warehouse model BigQuery, Snowflake, or Databricks not in the MAP's native campaign influence reporting.
How to Build the Campaign Hierarchy in Salesforce for Event Attribution
The Salesforce campaign hierarchy is the infrastructure that makes roll-up event reporting possible. Without it, every event exists as a flat record with no connection to other events, no aggregated program-level view, and no way to compare event performance across the year.

The correct 3-level hierarchy for a B2B events program works like this.
At the top sits the program-level parent campaign. This is the container for the entire annual events portfolio "2026 Events Program." Every event that runs this year rolls up to this parent. The parent campaign report shows: total events run, total pipeline sourced, total pipeline influenced, total cost, program-level ROMI. This is the number the CMO uses in annual planning.
Below the parent sit individual event child campaigns one per event. "SaaStr Annual 2026." "RSA Conference 2026." "Q2 Customer Advisory Board." Each child campaign carries the full P&L for that specific event: total cost, attendees sourced from target account list, opportunities created within 90 days, pipeline influenced within 180 days. This is the number used for event-by-event comparison.
Below the child campaigns sit optional activity-level sub-campaigns one per activity within the event. "SaaStr 2026: Main Booth." "SaaStr 2026: VIP Executive Dinner." "SaaStr 2026: Keynote Session." Sub-campaigns allow attribution down to the specific activity that drove the opportunity, not just the event as a whole. This level is optional but materially improves targeting decisions for the following year.

The campaign member status schema is equally important. "Attended" is not a status schema it is a single binary point. A properly designed campaign member status schema reflects engagement depth:
Registered: invited and registered, did not attend
Attended: attended the event, no specific session or activity data captured
Attended Session: attended at least one tracked session
High Engagement: attended 2 or more sessions or visited sponsored booth
Executive Engagement: participated in roundtable, VIP dinner, or executive track
Responded: submitted survey, booked meeting, or requested follow-up
These engagement-weighted statuses are what make post-event behavioral segmentation possible. They are also what make the attribution model in the data warehouse meaningful high-engagement attendees from target accounts weight differently than registered-but-no-show in the pipeline influence calculation.
Feeding Event Data from Marketo and HubSpot into the Attribution Model
The MAP is the connective tissue between the event platform and the pipeline attribution model. Data flows in one direction from the event platform into the MAP, from the MAP into Salesforce, from Salesforce into the data warehouse and the quality of that flow determines the quality of everything downstream.
The event platform export that matters contains four data elements: the attendee list with email address and company domain as the primary matching keys, session attendance records with attendee identifier and session name, booth visit records with attendee identifier and dwell time if available, and survey responses with attendee identifier and response data.

In Marketo, this export becomes an event campaign with program membership. Each attendee is added as a program member, and the status field is populated based on the engagement schema described above. Activity records "Attended Event Session," "Visited Booth" are logged as custom activity types against the contact record. These activity records are what allow the attribution model to distinguish high-engagement attendees from badge-only scans.
In HubSpot, the same logic applies through custom event tracking and contact properties. Each contact who attended gets an event engagement score property updated. Custom activities capture session and booth behavior. The contact's engagement history cross-hatched with their MAP campaign membership history and any open deal records in HubSpot CRM forms the input data for the attribution model.
The single most common data quality failure at this stage is incomplete matching. If the event platform export uses business email addresses and the MAP contact database has personal email addresses for the same contacts, the match rate falls below 60% and attribution is materially undercounted. Matching on company domain as a secondary key and flagging account-level matches where the contact is not directly identified recovers a significant portion of this lost attribution.
Building the Pipeline Attribution View Outside Native Platforms
Native platform attribution Marketo's Influence report, HubSpot's attribution dashboard works for campaigns with 14-day windows and single-threaded account contacts. It does not work for B2B events, for 2 structural reasons.

First, B2B buying committees are multi-threaded. A single enterprise account may have three contacts who attended the same event: the economic buyer in the executive track, the technical evaluator at the product demo booth, and the procurement contact at the general session. Native attribution treats these as three separate campaign member records. The attribution model that connects them to a single Opportunity and correctly assigns event credit at the account level requires joining campaign member data across multiple contacts in a SQL query that native platforms cannot execute.
Second, 90-day and 180-day attribution windows require storing and querying historical touchpoint data across multiple months. Native MAP and CRM reporting is optimized for recent activity. Attribution windows longer than 30 days typically require custom report configurations that are fragile, slow, and often inaccurate.
The data warehouse model that marqeu builds in BigQuery, Snowflake, or Databricks depending on the client's existing stack solves both problems. The core tables are:
`event_attendees`: one row per attendee-event pair, with engagement tier, session count, booth visits
`map_touchpoints`: full campaign member history per contact, with timestamp and campaign type
`crm_opportunities`: opportunity records with contact association, stage, close date, and value
`account_matching`: company domain to Salesforce account mapping for contact resolution
The attribution query joins these four tables on contact identifier and account identifier, applies the 90-day preliminary and 180-day final window filters, and calculates both sourced and influenced pipeline at the event level. The output is a clean table of: event name, opportunities sourced, sourced pipeline value, opportunities influenced, influenced pipeline value, total event cost, cost per opportunity, and event ROMI.
A production-ready implementation of this model across a typical B2B client's stack with Marketo or HubSpot, Salesforce, and a major data warehouse takes 3 to 4 weeks to build and validate. The model itself is approximately 400 to 600 lines of SQL across 3 to 4 source tables. No data engineers required on the client side.
The Two Reports Every CMO Needs: CFO Version and CMO Version

The same attribution model produces two different reports for two different audiences. Both should be generated from the same underlying data. The difference is framing and level of detail.
The CFO report is a single-page view of the events portfolio. Columns: event name, total cost, pipeline sourced (count and value), pipeline influenced (value), cost per opportunity, ROMI. One row per event. Annual program totals at the bottom. This report is built to sit alongside the paid media performance table and the content attribution table in the quarterly business review. It answers the CFO's question in the same units dollars that every other channel uses.
The CMO report is the operational view. It adds the following: attendance count by ICP tier (total attendees and what percentage were target accounts), attendee-to-opportunity conversion rate, pipeline sourced as a percentage of total pipeline in the quarter, and trend view comparing the same event year over year. The CMO report is used for event mix decisions which event types produce the highest conversion rate, which events are improving or declining, and how to allocate the following year's budget.

For a $180M B2B data infrastructure client we worked with, implementing both reports revealed a counterintuitive finding: their two largest trade show events by spend produced the lowest ROMI in the portfolio, while three smaller hosted roundtables produced pipeline influenced at 11 to 14 times cost. That reallocation decision moving 20% of the trade show budget into additional hosted roundtables was made on the basis of three rows in the CFO report. No gut feel required.
Common Attribution Mistakes That Undercount Event Impact
The attribution mistakes that consistently undercount event pipeline impact fall into four patterns.
14-day window default. The most common mistake. Every major MAP ships with a 14-day default because that is the correct window for digital campaign attribution a prospect who clicks a paid search ad and converts within two weeks. Events are not digital campaigns. The correct window starts at 90 days and extends to 180 for final reporting.

Sourced-only reporting. Reporting pipeline sourced by events and ignoring pipeline influenced systematically undercounts event impact by 60 to 80% in most B2B programs. Sourced pipeline is a high bar it requires the event to be the first meaningful touch AND for an opportunity to be created within the attribution window. Most event value accrues in the influence layer: existing pipeline that was accelerated, stalled deals that were reactivated, late-stage evaluators who gained conviction from a keynote. These are real revenue contributions. They disappear from the report when only sourced pipeline is measured.
Single-contact attribution on multi-contact accounts. If the attribution model matches campaign members to opportunities at the contact level rather than the account level, every account with multiple attendees is undercounted. An account where three contacts attended and two were not directly associated with the opportunity receives zero credit in a contact-level model. The fix is account-level matching joining campaign members to opportunities via the account field, not the contact field alone.
Missing pre-event MAP engagement cross-hatch. Attribution models that look only at post-event behavior miss a significant signal. A contact who attended a session on day two of a conference was already engaged before day one they registered, clicked the pre-event nurture emails, and downloaded the session guide. That pre-event engagement is part of the buying journey. Stripping it out undervalues the event's role in the buyer relationship.

Frequently Asked Questions About Event Pipeline Attribution
What is event pipeline attribution?
Event pipeline attribution is the process of connecting event attendance and engagement data to CRM opportunity records to calculate how much pipeline both net-new and influenced can be attributed to a specific event or events program. It requires joining data from the event platform, marketing automation platform, and CRM, typically through a data warehouse layer.
How long should an event attribution window be?
For B2B events, the attribution window should be a minimum of 90 days for preliminary reporting and 180 days for final annual reporting. The standard 14-day default in most MAPs is calibrated for digital campaign attribution and dramatically undercounts event impact across typical B2B deal cycles of 3 to 9 months.
What is the difference between event-sourced and event-influenced pipeline?
Event-sourced pipeline counts opportunities where the event was the first meaningful touch that preceded opportunity creation. Event-influenced pipeline counts any closed opportunity where an event touchpoint appeared anywhere in the account's buying journey. Both metrics are required for a complete event ROI calculation sourced alone understates impact by 60 to 80% in most B2B programs.
Why do native platforms undercount event pipeline attribution?
Native MAP and CRM attribution tools apply short default windows (14 to 30 days), match at the contact level rather than the account level, and cannot handle the multi-threaded buying committees that are typical in B2B sales. A data warehouse model joins campaign member records, opportunity records, and contact-to-account mapping in SQL to produce accurate attribution across 90 to 180-day windows.
Ready to Build Your Event Attribution Model?

The gap between "the booth was busy" and "here is the pipeline our events program produced this year" is not a headcount gap or a technology gap. It is a data architecture gap. The event platform data exists. The MAP data exists. The CRM pipeline data exists. What is missing is the schema design, the Salesforce campaign hierarchy, and the SQL model that connects them into a CFO-ready attribution report.
This is the work marqeu does across B2B software, hardware, networking, data, and security companies. Our implementations combine 15 years of marketing domain depth Marketo, HubSpot, Salesforce with the SQL, Python, and data warehouse technical skills to build the attribution layer without requiring data engineers on the client side. The typical implementation timeline is 4 to 6 weeks from kickoff to a production-ready attribution model generating CFO-ready pipeline reports.
To discuss what building this capability looks like in your specific environment, start a conversation with our marketing analytics consulting practice.
For the strategic framework that governs the full events analytics lifecycle from pre-event targeting through post-event pipeline measurement see our event marketing analytics framework. For the post-event revenue play how to segment attendees and arm sales with contextual intelligence see our post-event revenue analytics guide.
For organizations building analytics infrastructure across demand generation, ABM, attribution, and database strategy, marqeu's B2B marketing analytics consulting practice covers the full scope from first data audit through board-ready reporting.
Book a Marketing Analytics Readiness Audit. With our marketing analytics consulting services, let us evaluate your current stack and give you a roadmap to building unified marketing analytics capabilities at your organization.


Comments