
MQL to Opportunity Conversion Rate (Demand Waterfall) Benchmarks
- marqeu

- Mar 23
- 12 min read

MQL to Opportunity Conversion Rate benchmark data for every stage of the B2B demand waterfall, with practitioner guidance on why your numbers differ from the averages and what to do about it.
You are in a quarterly business review. The CFO pulls up the demand-waterfall dashboard comparing your marketing funnel to “industry benchmarks.” According to the chart, your MQL-to-opportunity conversion rate is 14% well below the “35–40% average” she found in a report from a SaaS analytics firm. The room shifts. Marketing is on the defensive. Sales nods knowingly. And nobody stops to ask the question that actually matters: where did that benchmark come from, and does it measure the same thing you measure? This is the benchmarking trap that catches B2B marketing leaders every quarter.
Conversion rate benchmarks are among the most searched, most cited, and most misunderstood metrics in demand generation.

The numbers you find online range from 13% to 45% for the exact same funnel stage, depending on who published the report, how they defined MQL and opportunity, and whether they measured point-in-time snapshots or cohort-based progression.
A note on terminology: Different B2B organizations use different labels for the stages between MQL and closed revenue. Some call it MQL → SQL (Sales Qualified Lead) → Opportunity. Others collapse these into MQL → Opportunity directly. Some use SAL (Sales Accepted Lead) as an intermediate step.
Throughout this post, we use “MQL to Opportunity” as the primary frame because it represents the most universal handoff point: the moment a marketing-qualified lead converts into a sales-owned pipeline opportunity.
Where benchmark sources use SQL terminology, we have mapped their data to this framework. The underlying conversion dynamics are the same regardless of what your organization calls the stage.

At marqeu, as part of our marketing analytics consulting practice, we have implemented cohort-based demand waterfall conversion models across numerous B2B organizations. This post compiles the most current benchmark data available, breaks it down by industry vertical, marketing channel, and company size, and more importantly
explains why your own cohort data will always be more valuable than any published average. Use these benchmarks as a diagnostic starting point. Then build your own.
The Full-Funnel B2B Conversion Rate Landscape
Before isolating the MQL-to-opportunity stage, it helps to see where it sits within the broader funnel. Most B2B organizations track 5 core conversion points, and the performance at each stage compounds. A 5-point improvement at any single stage can lift total closed revenue by 12–18% which is why benchmarking stage-by-stage is far more actionable than tracking a single end-to-end number.
Average B2B SaaS Full-Funnel Conversion Benchmarks

The highlighted row is where the biggest drop-off occurs in most B2B funnels. The MQL-to-opportunity transition is where marketing’s work meets sales’ judgment and where misalignment, slow follow-up, and poor lead scoring do the most damage. It is also the stage where improvement yields the highest ROI, because every additional opportunity flows downstream into pipeline and revenue.
The MQL-to-opportunity stage is the single highest-leverage conversion point in the B2B funnel. A five-point improvement here compounds through every downstream stage.
MQL to Opportunity Conversion Rate Benchmarks by Industry
Industry vertical creates substantial variation in conversion performance. Buyer sophistication, regulatory complexity, sales cycle length, competitive intensity, and the number of stakeholders involved in a purchase decision all influence how efficiently MQLs convert to pipeline opportunities.
MQL to Opportunity Conversion Rates by B2B Industry Vertical

The spread is striking. Organizations with advanced behavioral lead scoring in B2B SaaS achieve 39–40% MQL-to-opportunity conversion, while insurance and telecom companies with longer buying cycles and fragmented decision-making struggle to reach 12%. This is why a single “average MQL-to-opportunity rate” is nearly meaningless without industry context.
At marqeu, we see the industry pattern hold consistently across our client engagements, but with an important nuance: companies that invest in behavioral scoring and tight marketing-sales alignment routinely outperform their vertical’s median by 10–15%. The gap between median and top quartile is not about industry it is about operational maturity.
MQL to Opportunity Conversion Rate Benchmarks by Marketing Channel
Where your MQLs originate has a dramatic effect on how well they convert to opportunities. Channel selection often determines conversion outcomes more than messaging, creative, or even product-market fit. The data below shows why allocating budget based on MQL volume alone is a recipe for pipeline disappointment.
MQL to Opportunity Conversion Rate by Lead Source Channel

The headline finding is that organic search produces MQLs that convert to opportunities at more than double the rate of paid search and nearly triple the rate of paid social. This is not surprising when you consider intent: someone who finds your company through a search for “B2B marketing attribution consulting” is fundamentally further along in their buying journey than someone who clicked a LinkedIn ad while scrolling through their feed.
But the channel story does not end at MQL-to-opportunity. Events and conferences convert just 24% of MQLs to opportunities but the opportunities that do emerge close at 40%, the highest close rate of any channel. This is the relationship-building premium. If your company sells complex, high-ACV solutions, events may deliver fewer opportunities but far more revenue per opportunity.
The best-performing B2B teams do not optimize for MQL volume. They optimize for opportunity yield per dollar spent and that calculation looks very different from a simple cost-per-lead comparison.
Why Published Benchmarks Will Mislead You (and What to Do Instead)
If you have read this far and are feeling uncertain about which benchmark to trust, that uncertainty is appropriate. The range of published MQL-to-opportunity conversion rates from 13% to 45% for the same funnel stage exists because there is no universal standard for what constitutes an MQL or a qualified opportunity. Three specific factors drive the variance.
1. Definition Drift: Not All MQLs Are Created Equal
Some organizations define an MQL as any lead that fills out a form on a high-intent page (a demo request, a pricing inquiry). Others define it as any lead that crosses a behavioral scoring threshold, which might include downloading 3 blog posts and visiting the pricing page. The first definition produces a small, high-quality MQL pool with conversion rates north of 35 percent. The second produces a larger pool with conversion rates closer to 13–15 percent. Both organizations might report their MQL-to-opportunity rate publicly, and both numbers are accurate for their specific definition.
2. Measurement Method: Snapshots vs. Cohorts
Point-in-time measurement counts how many MQLs exist in the system today and how many opportunities were created today. Cohort-based measurement tracks a specific set of leads created in a given time window and follows them forward through every stage. The cohort method is far more accurate for B2B, where sales cycles span weeks or months, but it also tends to produce higher conversion rates because it gives leads time to progress. Many published benchmarks use the snapshot method, which systematically undercounts conversion.
At marqeu, we implement cohort-based demand waterfall conversion models as the default approach across every engagement. The methodology is detailed in our comprehensive demand waterfall conversion rates framework. Cohort tracking is the only way to get conversion numbers you can actually forecast from.

3. Stage Taxonomy Variation
The terminology itself creates confusion. Some organizations track MQL → SAL → SQL → Opportunity as four distinct stages. Others collapse these into MQL → Opportunity. A company reporting a “40% MQL-to-SQL rate” where SQL is their first sales touchpoint is measuring something very different from a company reporting a “40% MQL-to-Opportunity rate” where opportunity means a fully qualified deal in pipeline. When reading published benchmarks, always check whether the endpoint is a sales-accepted lead, a qualified lead, or a pipeline opportunity because these represent fundamentally different conversion gates.
4. Company Stage and GTM Motion
A Series B SaaS company running primarily inbound marketing to SMB buyers will naturally show higher MQL-to-opportunity rates than an enterprise infrastructure company running outbound plays against Fortune 500 accounts. The enterprise company is not underperforming its funnel is structurally different. Comparing these two conversion rates without accounting for deal size, sales cycle length, and buying group complexity is comparing apples to aircraft carriers.
Benchmarks are a starting point for diagnosis, not a target for performance. Your own cohort data, sliced by segment, channel, and campaign type is the only number you should plan from.
How to Build Conversion Benchmarks from Your Own Data
The most useful benchmark is the one you build yourself. Here is the approach we use at marqeu when implementing conversion intelligence for clients, refined through our engagements across B2B SaaS, hardware, networking, data, and security companies.
Step 1: Establish Your Baseline by Cohort
Pull 6–12 months of historical data. Group leads into monthly or quarterly cohorts by their creation date. For each cohort, calculate the percentage that reached MQL status, then the percentage of those MQLs that converted to opportunities, and so on through forecast and close. This gives you your internal baseline the number against which all improvement should be measured.

Step 2: Slice by the Dimensions That Matter
Aggregate conversion rates hide more than they reveal. At minimum, cut your data by lead source channel (organic, paid, events, outbound), account segment (SMB vs. mid-market vs. enterprise), industry vertical, and product line. You will almost certainly find that your “average” MQL-to-opportunity rate is an average of dramatically different sub-populations. An organic inbound MQL from a mid-market SaaS company might convert at 45%, while a content syndication MQL from an enterprise manufacturing account converts at 8%. Both are MQLs in your system but they are not the same kind of lead.
Step 3: Add Velocity and Aging
Conversion rate without velocity context is incomplete. An MQL-to-opportunity rate of 25% is excellent if the median time is 5 days. The same 25% is a problem if the median time is 45 days because it means your SDR team is either slow to work leads or your scoring model is surfacing leads too early. Track median days between stage transitions for every cohort, and set internal SLAs. In our experience, the organizations that combine conversion rate tracking with velocity SLAs see 20–30% more pipeline from the same lead volume.
Step 4: Benchmark Quarter over Quarter, Not Against the Internet
Once you have two or three quarters of cohort data, your own trend line becomes the benchmark. Is your MQL-to-opportunity rate improving? Is it improving faster for organic leads than paid? Is your enterprise segment catching up to your SMB segment? These questions are infinitely more actionable than asking whether you are above or below an industry average that was calculated from companies with different definitions, different GTM motions, and different data quality.
What Benchmark-Beating Performance Looks Like: Client Examples

A Mid-Market Cybersecurity SaaS (200–500 Employees)
When marqeu began the engagement, this company was tracking an MQL-to-opportunity conversion rate of 11% below the 16% median for cybersecurity. Investigation revealed two root causes:
their lead scoring model was purely demographic (job title and company size), with no behavioral component
their SDR team had no defined SLA for lead follow-up, averaging 72 hours to first touch.
We implemented behavioral scoring tied to high-intent actions (pricing page visits, competitor comparison page views, case study downloads) and established a 4-hour follow-up SLA. Within 2 quarters:
MQL-to-opportunity rate reached 24 percent top quartile for their vertical
Median lead response time dropped from 72 hours to 3.2 hours.
Pipeline generated from the same MQL volume increased by 118 percent.
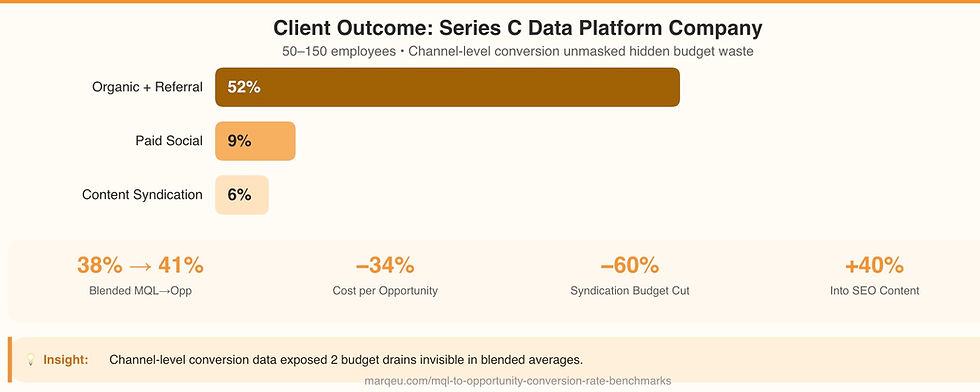
A Series C Data Platform Company (50–150 Employees)
This company’s reported MQL-to-opportunity rate was 38%, which looked healthy. But when marqeu segmented the data by channel, the picture changed dramatically:
Organic and referral MQLs converted at 52%.
Paid social MQLs converted at 9%.
Content syndication MQLs converted at 6%.
The “healthy average” was masking two channels that were burning budget while delivering almost no pipeline. We recommended reallocating 60% of the content syndication budget into SEO content production and the remaining 40% into a targeted referral partner program. Six months later:
Blended MQL-to-opportunity rate had increased to 41%,
Cost per opportunity dropped by 34% because they were generating fewer low-quality MQLs and more high-converting ones.
An Enterprise Networking Hardware Company (1,000+ Employees)
Large enterprise deals involve buying groups of 6–10 stakeholders, and the traditional MQL model which is lead-centric, not account-centric systematically understates conversion in this environment. This company’s MQL-to-opportunity rate was 8%, which looked catastrophic. But when we restructured measurement around buying group engagement tracking whether multiple contacts from the same account were reaching MQL threshold simultaneously the effective conversion rate was 19% per qualified account.
The insight was not that the funnel was broken. The insight was that the measurement framework was wrong for their GTM motion. We implemented account-level qualification scoring alongside individual lead scoring, which gave their sales team a far more accurate signal of which accounts were genuinely in-market. Opportunity creation from account-qualified buying groups increased 42 percent in the following two quarters.
The Speed-to-Lead Multiplier: Response Time Benchmarks
No conversation about MQL-to-opportunity conversion is complete without addressing the single most controllable variable: how quickly your team responds to an MQL. The data on this is unambiguous and has been validated repeatedly across multiple studies.

Response Time Impact on MQL-to-Opportunity Conversion
A team that responds to MQLs within 5 minutes converts at more than triple the rate of a team that waits 24 hours. This is not a marginal improvement it is the difference between a healthy funnel and a broken one. And yet, the average B2B SDR team still takes 42 hours for first outreach. If you take nothing else from this post, take this: before you redesign your scoring model, rebuild your tech stack, or hire another BDR, measure your average time-to-first-touch. If it is over 30 minutes, fixing that alone will improve your MQL-to-opportunity conversion rate more than any other single intervention.
Lead Scoring Maturity and Its Impact on Conversion
The gap between organizations using basic demographic scoring and those using behavioral or predictive scoring models is one of the most significant performance differentiators in the benchmark data. Companies with mature scoring frameworks incorporating firmo-graphic fit, behavioral engagement signals, and predictive intent data consistently achieve MQL-to-opportunity rates 15–25% higher than those relying on demographic criteria alone.

The reason is straightforward: behavioral scoring identifies readiness to buy, not just fit to buy. A VP of Marketing at a 200-person SaaS company who has visited your pricing page three times, downloaded a comparison guide, and attended a webinar is a fundamentally different MQL than one who has the same title but was auto-scored based on a single form fill at a conference booth.
We detail the mechanics of building contextual scoring models in our lead scoring methodology. The key principle: scoring models should be recalibrated quarterly using actual conversion data. If a specific behavioral signal (say, visiting the pricing page) correlates with 3x higher opportunity conversion, your model should weight it accordingly and that weight should be updated as your product, messaging, and audience evolve.
Frequently Asked Questions
What is a good MQL to opportunity conversion rate for B2B SaaS?
For B2B SaaS companies with behavioral lead scoring and defined SDR SLAs, 25–40% is a strong range. Companies relying on basic demographic scoring typically see 13–15%. The industry median across all maturity levels is approximately 15–21%, but this average obscures wide variation by company size, channel mix, and scoring sophistication.
How do you calculate MQL to opportunity conversion rate?
Divide the number of opportunities created from a given MQL cohort by the total MQLs in that cohort, then multiply by 100. Cohort-based calculation (grouping MQLs by their creation month and tracking them forward) is more accurate than point-in-time snapshots, especially for B2B organizations with sales cycles longer than 30 days.
Why is my MQL to opportunity conversion rate lower than published benchmarks?
The three most common causes are definitional differences (your MQL threshold may be broader than the benchmark source’s), channel mix (heavy reliance on paid social or content syndication produces lower conversion), and response time (SDR teams averaging over 24 hours to first touch see 3–5x lower conversion rates than those responding within one hour). Additionally, published benchmarks sometimes measure MQL-to-SQL rather than MQL-to-opportunity, which may represent a different conversion gate in their framework.
What is the biggest lever for improving MQL to opportunity conversion?
Speed to lead. Organizations that reduce average MQL response time to under five minutes typically see MQL-to-opportunity conversion rates increase by 50–100%. After response time, behavioral lead scoring refinement delivers the next largest improvement.
Should I benchmark against industry averages or my own historical data?
Both, but in different contexts. Use industry benchmarks to identify whether your funnel is in the right ballpark and to diagnose which stage needs the most attention. Use your own cohort data sliced by segment, channel, and campaign to set improvement targets and forecast pipeline. Your own trend line is always more actionable than a published average.
From Benchmarks to Action: Building Your Conversion Intelligence
Benchmark data is valuable as a diagnostic compass it tells you which direction to investigate. But the real competitive advantage comes from building your own conversion intelligence: cohort-based models that track your specific buyers through your specific funnel, sliced by the dimensions that matter for your GTM motion.
Ready to Implement Your Demand Waterfall?
The demand waterfall is the single highest-leverage investment a B2B marketing organization can make in pipeline visibility and accountability. It transforms how you measure demand generation, how you align with sales, and how you report marketing’s impact to your board.

But implementation matters as much as intent. A poorly defined waterfall is worse than no waterfall it creates the illusion of measurement without the substance:
The stage definitions need to be precise.
The tech stack needs to capture the right data at the right transitions.
The reporting needs to go beyond snapshots into cohort analysis and velocity tracking.
The governance needs to keep the whole system calibrated as your business evolves.
If your organization is ready to implement a demand waterfall or if you’ve already started and the results aren’t matching expectations marqeu’s marketing analytics consulting team can help. We’ve deployed this methodology across numerous B2B organizations and know where the implementation traps are before you hit them. The first conversation is about understanding your current state your tech stack, your data maturity, and where the gaps are. From there, we build the roadmap.
Book a Marketing Analytics Readiness Audit. With our marketing analytics consulting services, let us evaluate your current stack and give you a roadmap to building unified marketing analytics capabilities at your organization.


Comments