
How our QBR-Ninjas are Transforming Marketing QBRs with Marketing Analytics
- marqeu

- Jul 22, 2024
- 6 min read

Marketing QBR seasons are undeniably thrilling periods for everyone involved in the marketing sector, particularly for those of us who consider ourselves analytics enthusiasts. During these pivotal times, discussions surrounding data and marketing analytics become the focal point of conversations, as teams engage in the crucial task of unearthing insights that will shape their narratives about the results and overall health of the business. This period represents a unique opportunity for marketing teams to showcase the tangible impact they have made on the organization, demonstrating not only their contributions but also the strategic value they bring to the table. Above all,
QBRs is the time to celebrate the wins, respect the lessons learned, and rally the teams around the exciting new initiatives aimed at achieving new business goals.
As we find ourselves on the cusp of yet another marketing QBR season, the atmosphere is charged with anticipation and energy. The air is thick with discussions about marketing analytics, and conversations centered around data are becoming increasingly prominent. Teams are diligently running and re-running reports, meticulously validating numbers, and crafting presentations that will effectively communicate their findings. Marketing leaders are eagerly awaiting the opportunity to dive deep into the data, ready to extract valuable insights that will help them weave together a compelling story. This story will not only reflect on the past quarter's performance but will also set the stage for strategic planning for the upcoming quarter.
During this season, the meticulous process of data analysis becomes paramount. It involves not just the collection of numbers but also a critical examination of what those numbers signify in terms of market trends, consumer behavior, and overall business performance. As teams sift through various metrics, they begin to identify patterns and correlations that can inform future marketing strategies. This analytical approach allows for a comprehensive understanding of what worked well and what areas require improvement, thereby fostering a culture of continuous learning and adaptation.
Moreover, the QBR season serves as a platform for collaboration and alignment within the marketing team and across other departments. It encourages cross-functional discussions that can lead to innovative ideas and initiatives.
By sharing insights and perspectives, teams can better understand the broader business context and how marketing can align its goals with the overall objectives of the organization. This collaborative spirit is essential for driving forward-thinking strategies that can propel the business to new heights.
The key business questions that our QBRNinjas like to answer in their Marketing QBRs and what metrics, data points they rely on to discover the insights and put together their storylines.
Last week, I was assisting one of our customers in preparing for their QBR. While reviewing the funnel's health, it occurred to me that many marketers are likely in the same situation right now—assessing performance and gearing up for their QBRs. Simultaneously, I realized that there are many marketers who are struggling to access the right data, trying to validate it instead of spending the necessary time to understand the results and objectively analyze performance. Given the strategic importance of QBRs, I often notice that marketing teams lack a well-defined approach for managing the QBR process, particularly in obtaining timely data access to evaluate performance and, more importantly, enabling their marketing analytics teams to conduct in-depth analyses of key areas needing attention. Often, this delay results in either excessive waiting or incorrect data.
Data and analytics are at the core of modern marketing. Whether it is the marketing team at a small start-up or an enterprise-level organization, every marketer needs access to performance data that is standardized and available real-time via self-serve dashboards.
Above all, she should have the confidence that the data her marketing analytics team provides accurately represents the health of the business and results of all the hard-work that she has been putting in.
She is expected to objectively analyze the performance, demonstrate the quantifiable impact her work is making towards driving the top line of the business. At marqeu, with our marketing analytics practice, we are focused on enabling marketers to get real-time access to performance data via self serve dashboards so that they can discover the insights to drive incredibly personalized customer experience and accelerate the revenue growth for their organizations.
Usually, about 80 % of the time is wasted in organizing data, building reports that don’t answer business questions, leaving any time for discovering insights. As I write this post, many marketers are living through this scenario and feeling helpless.
We are working on flipping this equation for our customers and QBRNinjas to get the data and reports ready in less than 20% of the time and have most of the time for discovering insights. This has been the biggest impact of our work and we could not be more proud!
Every organization has different sets of metrics that they use to evaluate the health of the business. Across all our customers, 3 sets of questions our QBRNinjas usually have:
a) Did we meet our goals both for volume and conversions?
We have been using demand waterfall performance to help answer this question. With our marketing analytics frameworks, we enable real-time visibility into the health of the funnel so that marketing teams can track inquiries, mqls, sqls, sals and wins across different sales segments, product lines, by different channels, tactics, and campaigns. Cohort based funnel conversions are a key part of evaluating the health of the funnel so as to get a good read into the quality of the leads flowing into the funnel and discover what kinds of leads are moving faster through the funnel, what the velocity looks like. Demand Waterfall conversions generally track 4 KPIs with some degrees of variation – Leads to MQLs, MQLs to SQLs, SQLs to SALs and SALs to Deals. These 4 KPIs provide insights into efficiency across the funnel and help with accelerating deals.

b) How much did we invest and what is the pipeline impact?
Across all marketing organizations (irrespective of the size, industry), the conversation now is moving more towards marketing ROI.
Finance and sales organizations expect marketing leaders to make smart decisions when it comes to budget allocation and more importantly within the marketing organizations, the leaders increasingly want to feel confident about these decisions
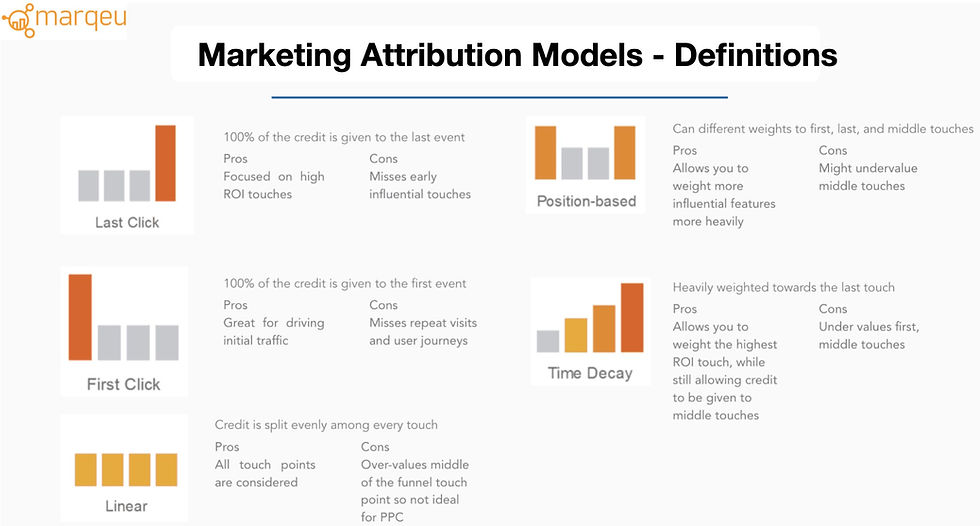
because it is these decisions that will help them meet their pipeline goals. This is where multi-touch campaign attribution comes into play and it is the most valuable of all the KPIs as it powers the marketing investment decision making which in turn drives the results for the marketing organization. Whether it is the First Touch, Last Touch, Multi-Touch, Equal Weight Multi-Touch or Weighted approach to marketing attribution, when implemented correctly and validated, the insights provided are of immense value for the marketing organization. These KPIs provide strategic insights to the marketing leaders and CMOs so that they can confidently demonstrate the impact that their organizations are making and help foster a strong working relationship for marketing within the c-suite, especially with the CFOs.
c) What is working in terms of driving the pipeline?
Driving new pipeline has always been the most important KPI for any marketing organization. The importance of demonstrating how marketing is impacting the pipeline has grown manifolds in the recent times.
The 2 commonly used metrics that demonstrate the impact of marketing are Marketing Pipeline Acceleration/Influence and New Pipeline Sourcing.
With these 2 metrics, organizations can quantify marketing-driven engagement across the accounts and relate them to the impact on pipeline. These pipeline correlations of the marketing activities provide valuable insights when it comes to understanding “when” the new opportunities were created in marketing engaged accounts and for the accounts with existing opportunities, how marketing was able to influence deal expansions and accelerate deal closures. These 2 KPIs provide a foundation for marketing leaders have impactful conversations with their sales counterparts. At the same time,
these KPIs are very influential when it comes to evaluating the market mix across marketing tactics and channels in different phases of the buying cycle.
We are always on the lookout for inputs and examples from the marketing and sales communities to keep adding value for our customers. We would welcome the inputs from other leaders and practitioners around what kind of questions are being asked by sales and marketing teams during the QBRs at your organizations and how you go about answering them.
Let’s discuss how marketing analytics can transform your marketing strategy and make it a cornerstone of your marketing success. Reach out today, and let’s build your next big win together!
With our marketing analytics consulting services, let us evaluate your current stack and give you a roadmap to advanced marketing analytics capabilities.


Comments